Exploratory Research
Interview
UX Research and prototyping
1. Conducted user interview and created persona to better understand the target user group.
2. Iteratively designed the user interface using low-fidelity prototype to high-fidelity prototype
3. Conducted user testing to evaluate the design solution
4. Published our work and presented in conference
Team of 4 for 8 weeks
Minkyu Jung (Designer)
Jaeha Lee (Designer)
Wonsun Choi (Designer)
Interview, Persona, Storyboard, Wireframe, High-fidelity Prototype
Publication in Society of Design Convergence (2016)
Presentation in HCI Korea 2016 Conference
Poster presentation in Incheon International Design Fair 2015
Arduino (C), Illustrator
Sweepa is an indoor waste monitoring system that aims to increase convenience and work efficiency of cleaning staff by measuring the fill-level of trash cans and analyzing data.
Recently, the volume of household and non-household waste has increased through the rapid industrial and economic development in Korea and the government has put efforts such as a volume-based waste fee system to mitigate environmental problems. While research studies mainly have focused on effective waste management and recycling behavior in a systematic way, there is relatively little research on human resources who actually collect waste and handle recycling work. In this project, we suggest an indoor waste monitoring system that seeks to provide cleaning staffs with a more effective work flow.
Kim, E.K., Jung, M.K., Kang, Y.A. (2016), SWEEPA: Designing An Indoor Waste Monitoring System For Increased Work Efficiency, Society of Design Convergence, 15(2), 119-133.
Kim, E.K., Jung, M.K., Kang, Y.A. (2016), “SWEEPA: Designing An Indoor Waste Monitoring System”, HCI Korea 2016 Conference
We published our work in Society of Design Convergence (2016). Link is on the right column of this page. We also participated in HCI Korea 2016 Conference and presented our project.
Interview
Persona
Design Requirements
Sketch
Wireframe
Hardware prototype
User Testing
We adopted a user-centered design methodology and conducted a formative evaluation with the cleaning staffs to better understand user needs and identify design requirements. We started our research by investigating how the current cleaning system is operated in indoor spaces and under what circumstances cleaning staff members have during their work. We interviewed 4 cleaning staff members, 2 women and 2 men at International Yonsei University Campus. We received the permission from the Yonsei University administration office and contacted the commander of the cleaning staff team to arrange an interview with cleaning staff. Interviews were semi-structured, open-end ed and covered three topics: (a) general information about the participants (b) roles and work routines as cleaning staff members (c) work environment and equipment they use. Interviews lasted about 30 minutes and were recorded via mobile phone audio. After gathering and analyzing data from interviews, we could come up with design requirements for the implementation of the system.
Efficient Work Routine
Intuitive UI
Hardware Customization
Data Collection
Majority of the cleaning staffs feel inefficient to travel to designated areas and check all the trashcans when a lot of the times many of the trashcans are almost empty. We sought to achieve labor efficiency through a system that notifies the status of the trashcans to cleaning staff. In such a system, the status of the trashcans indicates the real time fill level of them.
We found that almost all of the cleaning staff are between the age of 50 and 60. Typically, individuals in this age group have a farsightedness due to limited physical capability and have a slower adoption and learning curve of smart devices. Thus, the user interface of the system should be simplified to its essential functions only and if the application required user input, instructions should be made clear on the screen itself.
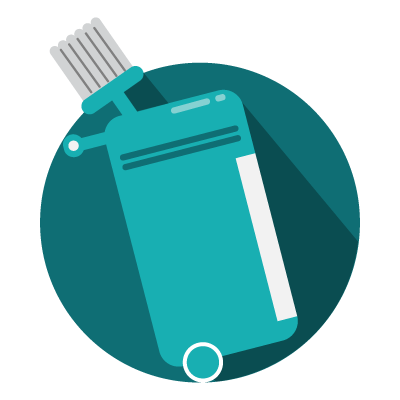
Different roles were assigned to male and female staffs in the current cleaning system. This implies that hardware devices need to be customized for male and female workers. For example, male cleaning staff mainly works in a recycling room where they collect and sort the trash depending on its use. On the other hand, female cleaning staff has to constantly move from place to place to empty the trashcans. They usually have individual cleaning carts containing cleaning equipments and they have to keep their carts with them all the time.
Cleaning staff members have different amount of workload depending on the locations of their designated areas. There are some areas that the trash fills up much quickly than other areas and one of the interviewees felt unfair to see some of cleaning staff members who work less than her. Therefore, managers and staff members need to obtain database that collects accumulated information of each trashcan fill-level in order to fairly distribute the work to every member.
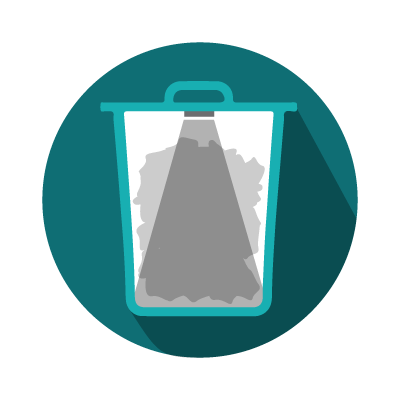
A distance sensor attached to the inner side of trashcans detects the fill-level of trash
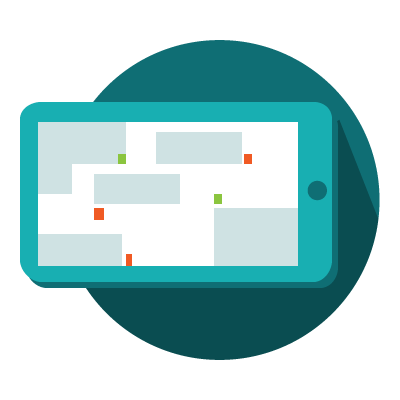
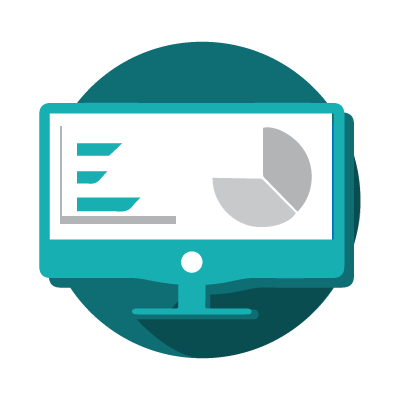
After receiving the data, the digital floor map will show different colors of trashcans depending on the fill-level of trash
Female cleaning staff sees the map through a portable device attached to the cleaning cart so she can make her own optimal routes
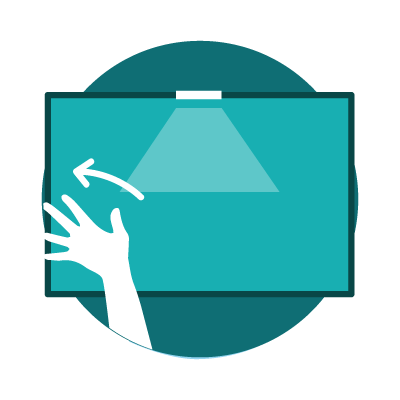
Male cleaning staff sees the map through a display in the recycling room controlling it through kinect sensor
Head managers can use the data to equally distribute workload and for different purposes
Through a visual map that shows fill-level of trashcans, cleaning staff members can have real-time feedback of the locations of the trashcans that need to be emptied. Also, the colors of trashcans accordingly change depending on the fill-level of trash: green (20 % or less) yellow (21% -79%) red (80% - 100%) to notify cleaning staff specific status of each trashcan. Cleaning staff member can check different floors to see other status of other trashcans and check their location through direction icon which becomes beneficial when making their own efficient work routes. From the earlier user study, a cleaning staff member pointed out that he easily forgets information; therefore, the system should help cleaning staff members to remember information anytime. To solve this, Sweepa came up with two ways for both female and male cleaning staff members by making the map accessible at all times, which enables work efficiency for the cleaning staff. The application flow of user interface is listed below.
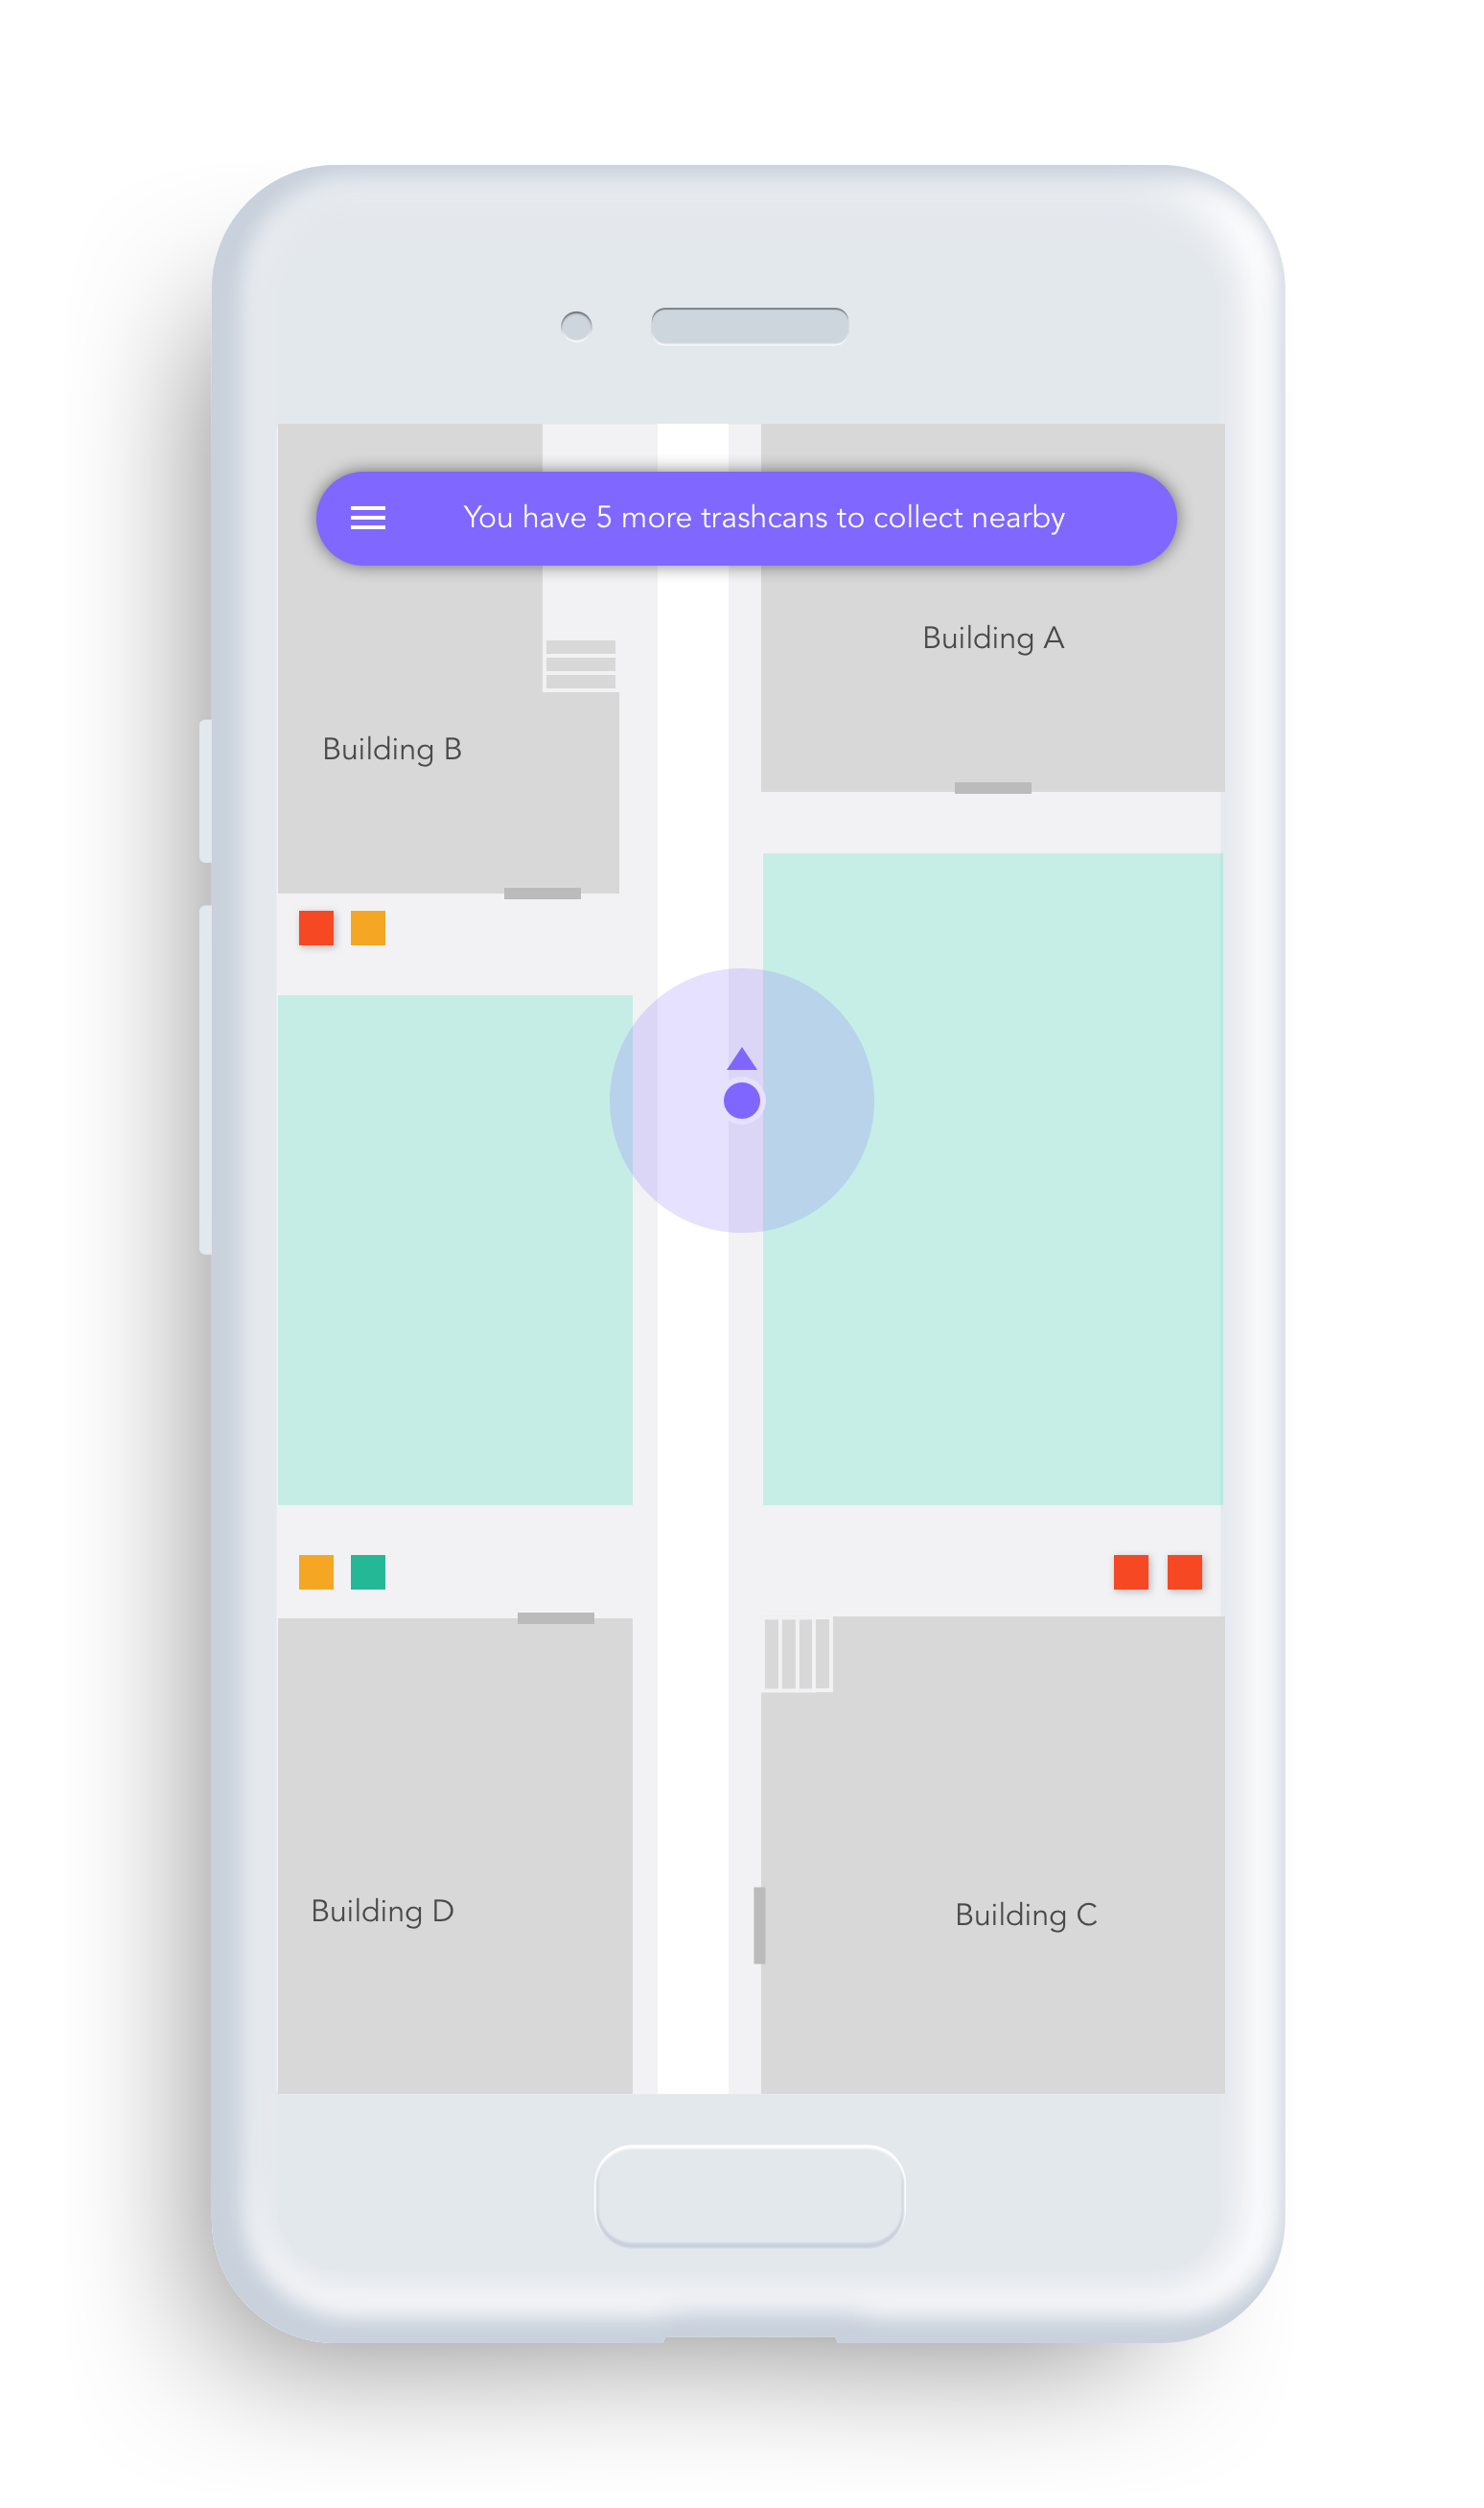
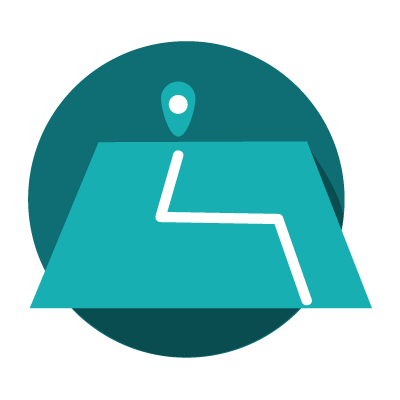
Outside view of the buildings.
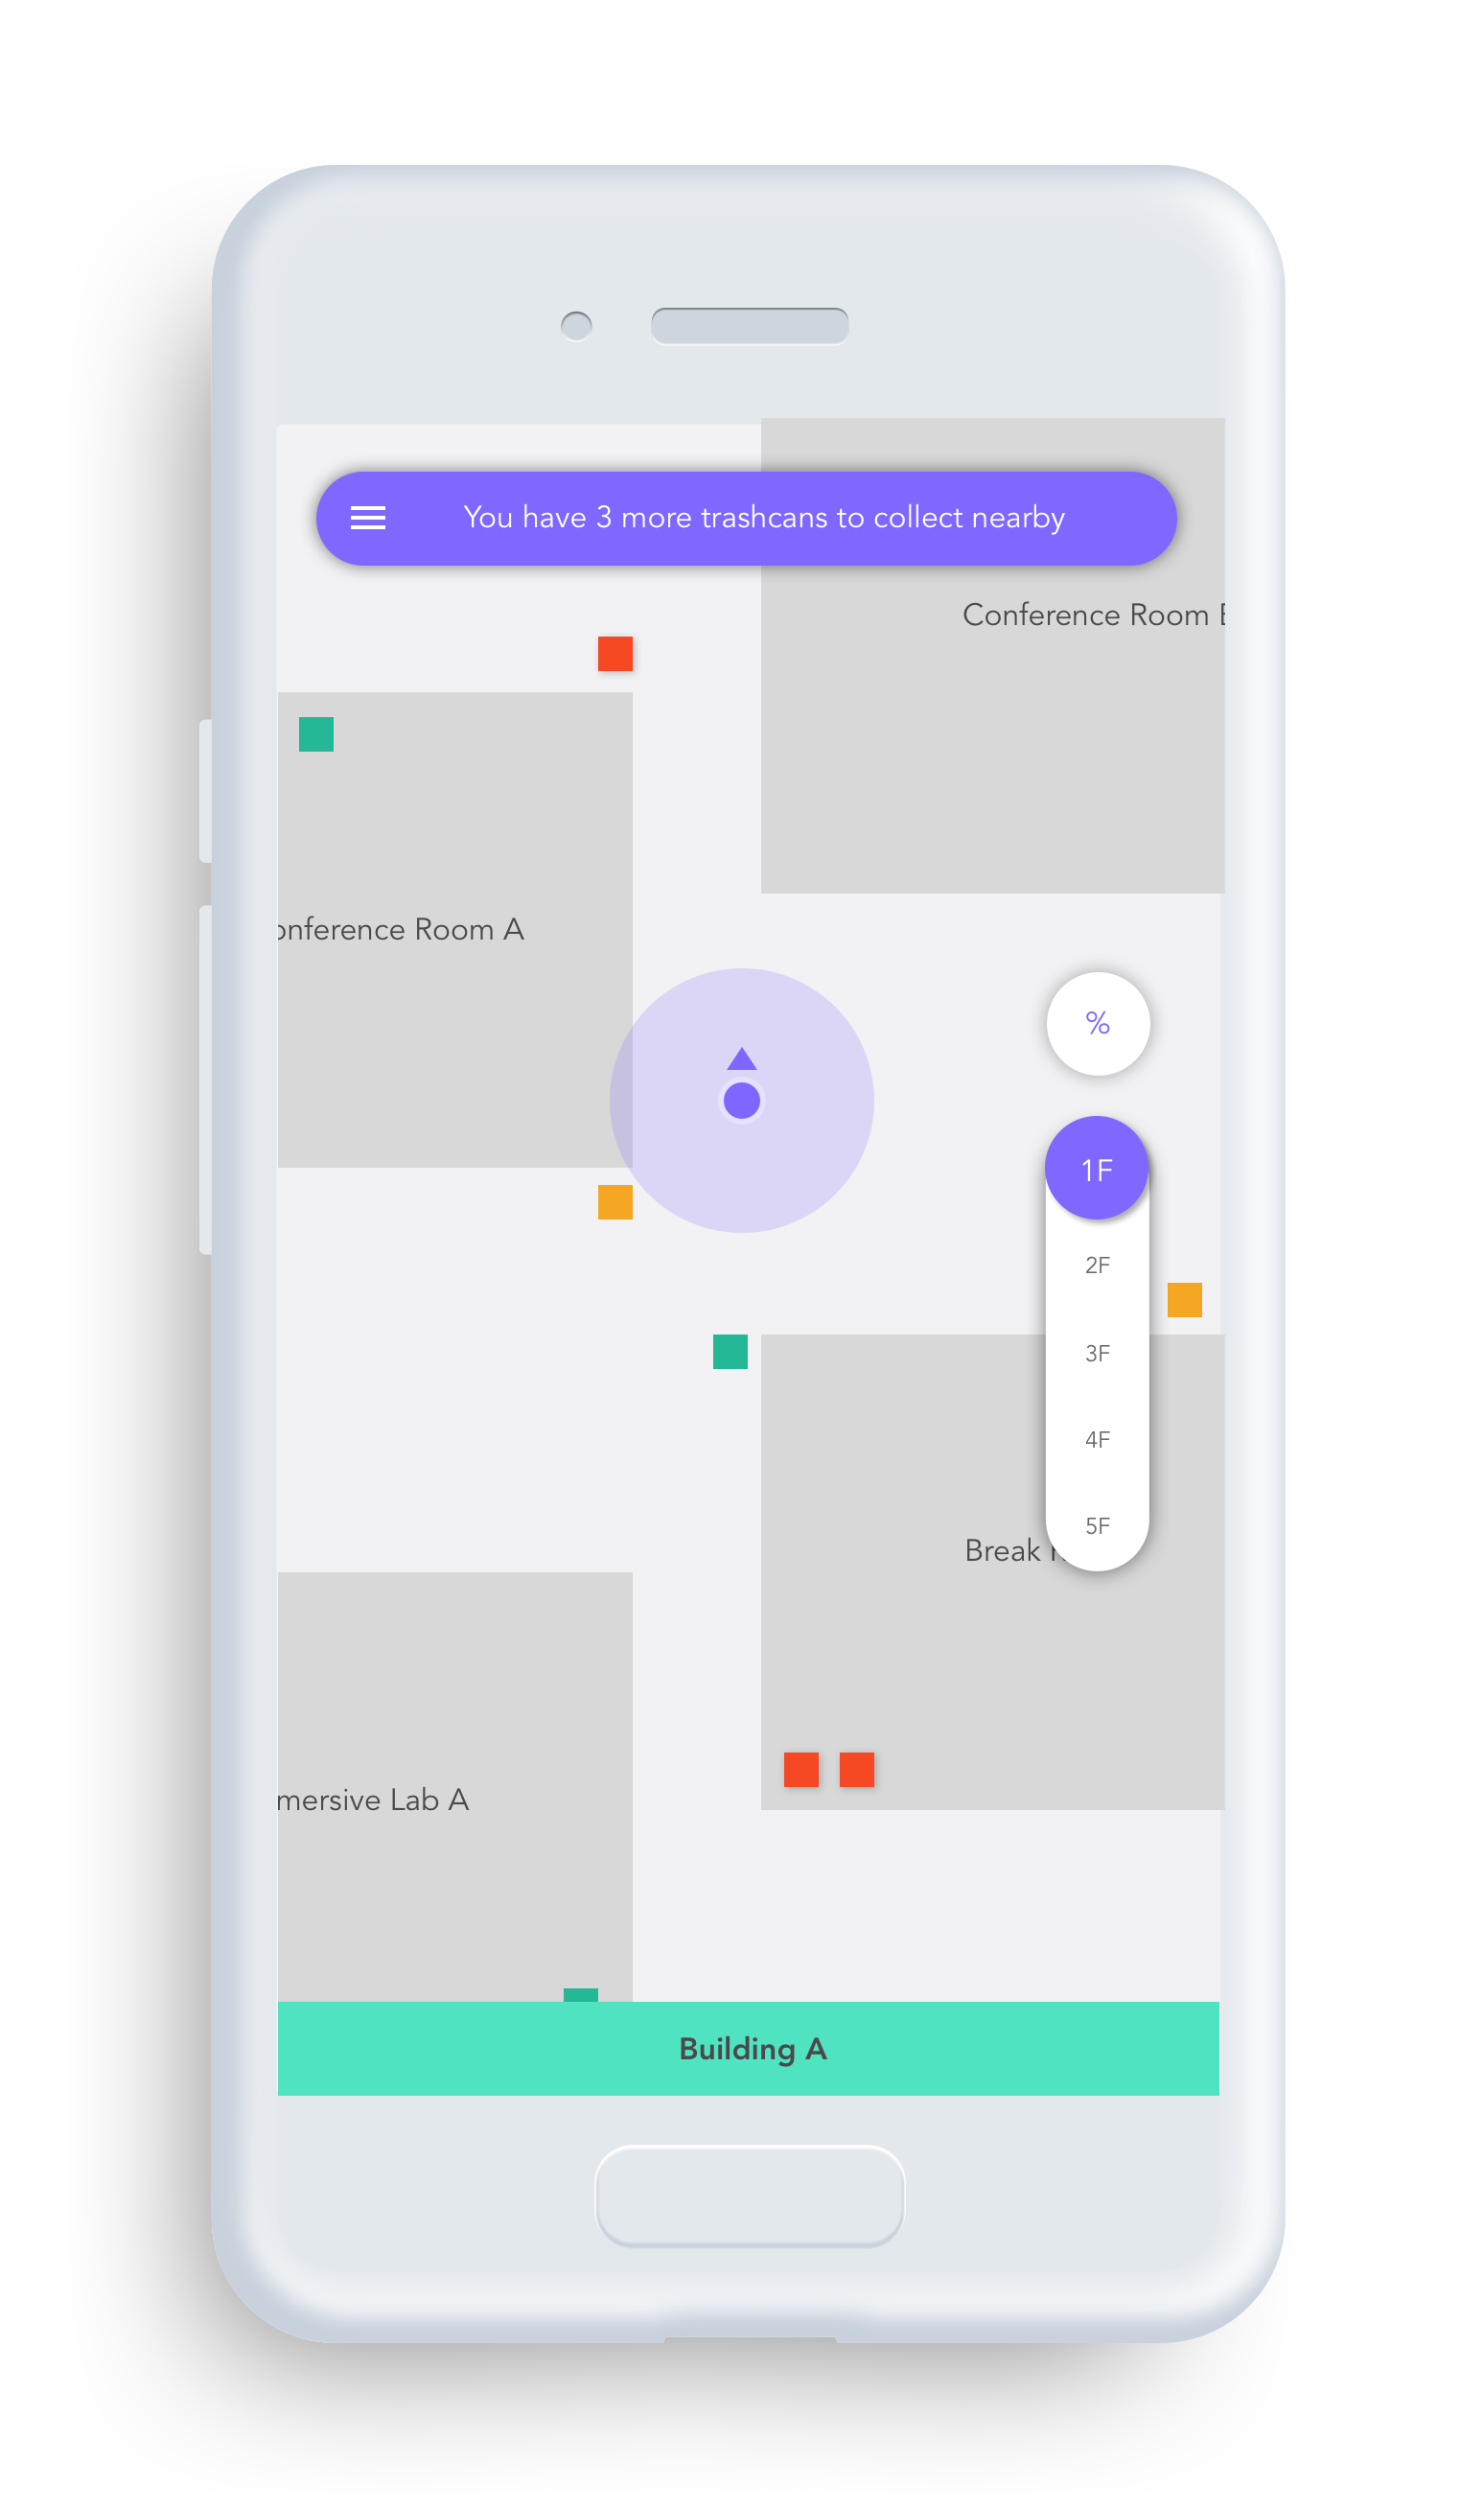
Inside view of a building.
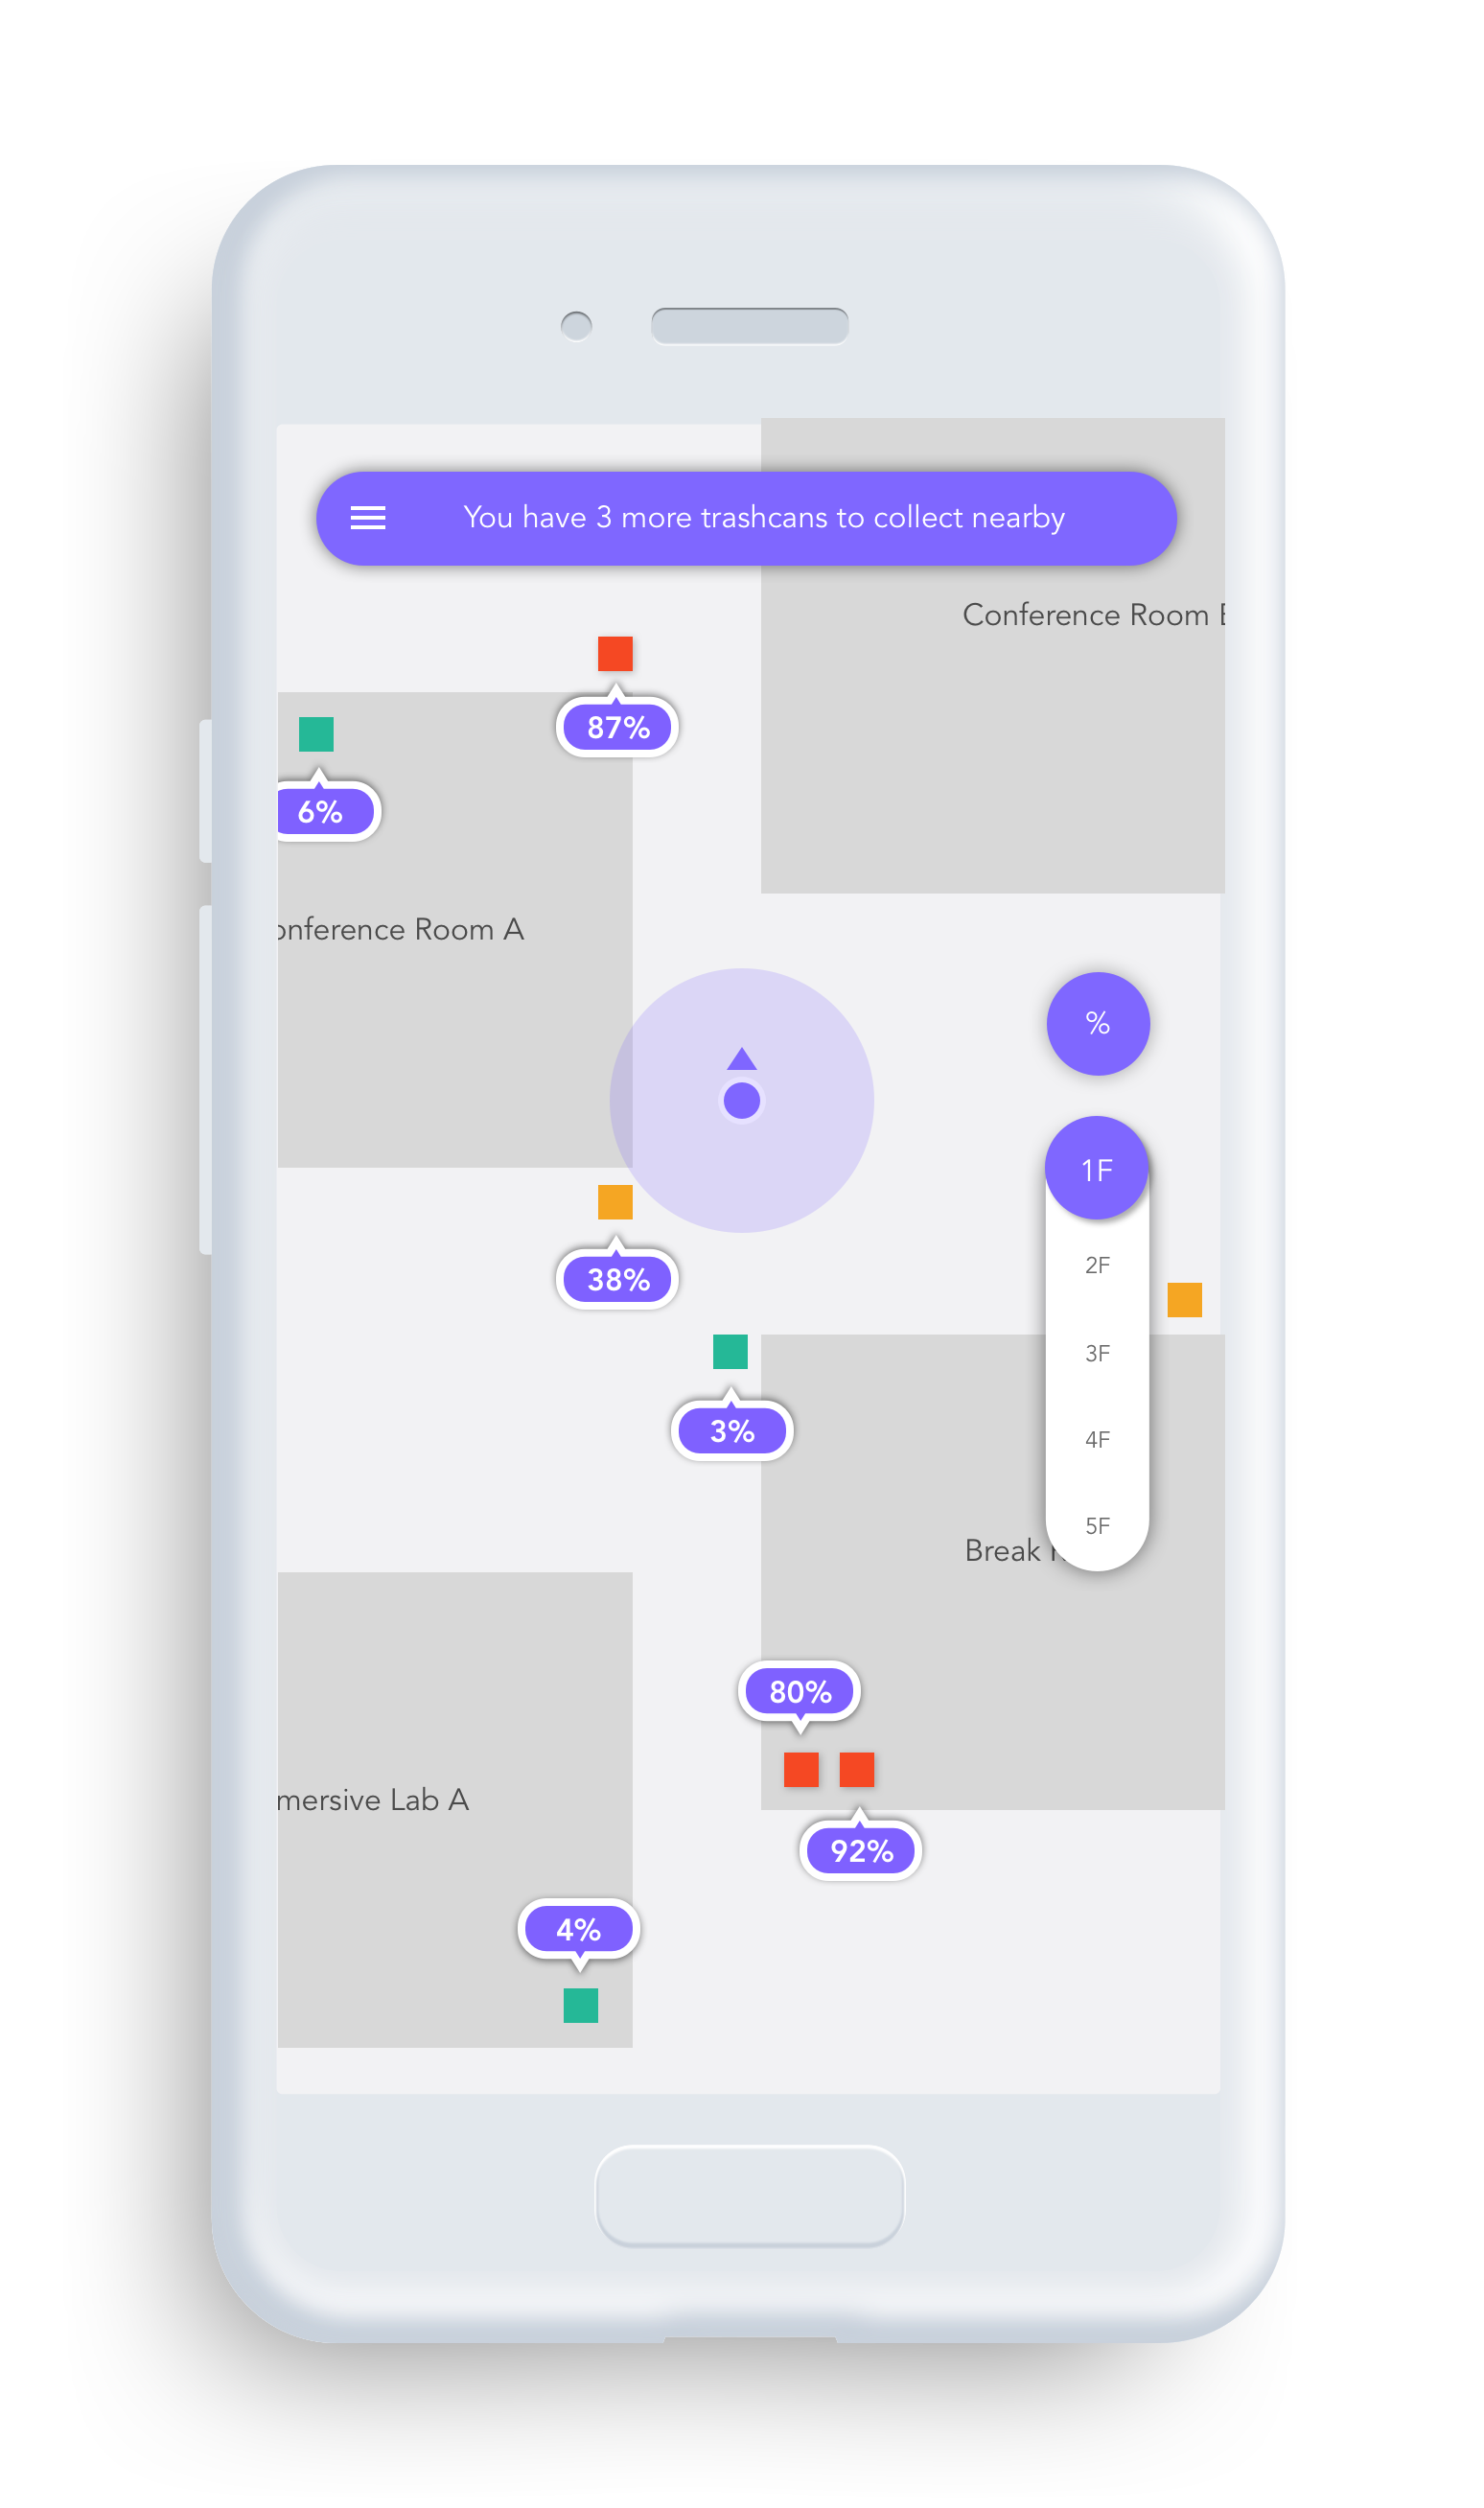
Percentage option provides more accurate fill-level information to users.
By putting the map on portable devices, female staff can receive information without any spatial and time limitations. Just by a simple installation process of a mobile application, the staff will easily access to the map not having to make additional purchases for extra digital device. The visual map on display will work as the mini Intranet for the workers, and since smartphones became a daily necessity and almost everyone knows how to use a smartphone, any form of switching cost, such as timely adaptation process, will not occur.
The visual map is also displayed on television screen in the recycling room where male cleaning staff members conduct most of their duties. Since male staff members must have their gloves on while they are working, they have to take the gloves off in order to access the display attached to the wall. To avoid this disturbing process of taking off their gloves repeatedly, we added a kinetic sensor to the display that allows the male users to have easier access to the service even from a distance.
Sweepa system collects data on the high and low season for trash output, the time when people use the trashcans the most, the status of the trash depending on the location such as building, floor, and adjacent services or environments. The data collected from Sweepa can then be processed into useful information which can be used for reducing work load, increasing work efficiency.
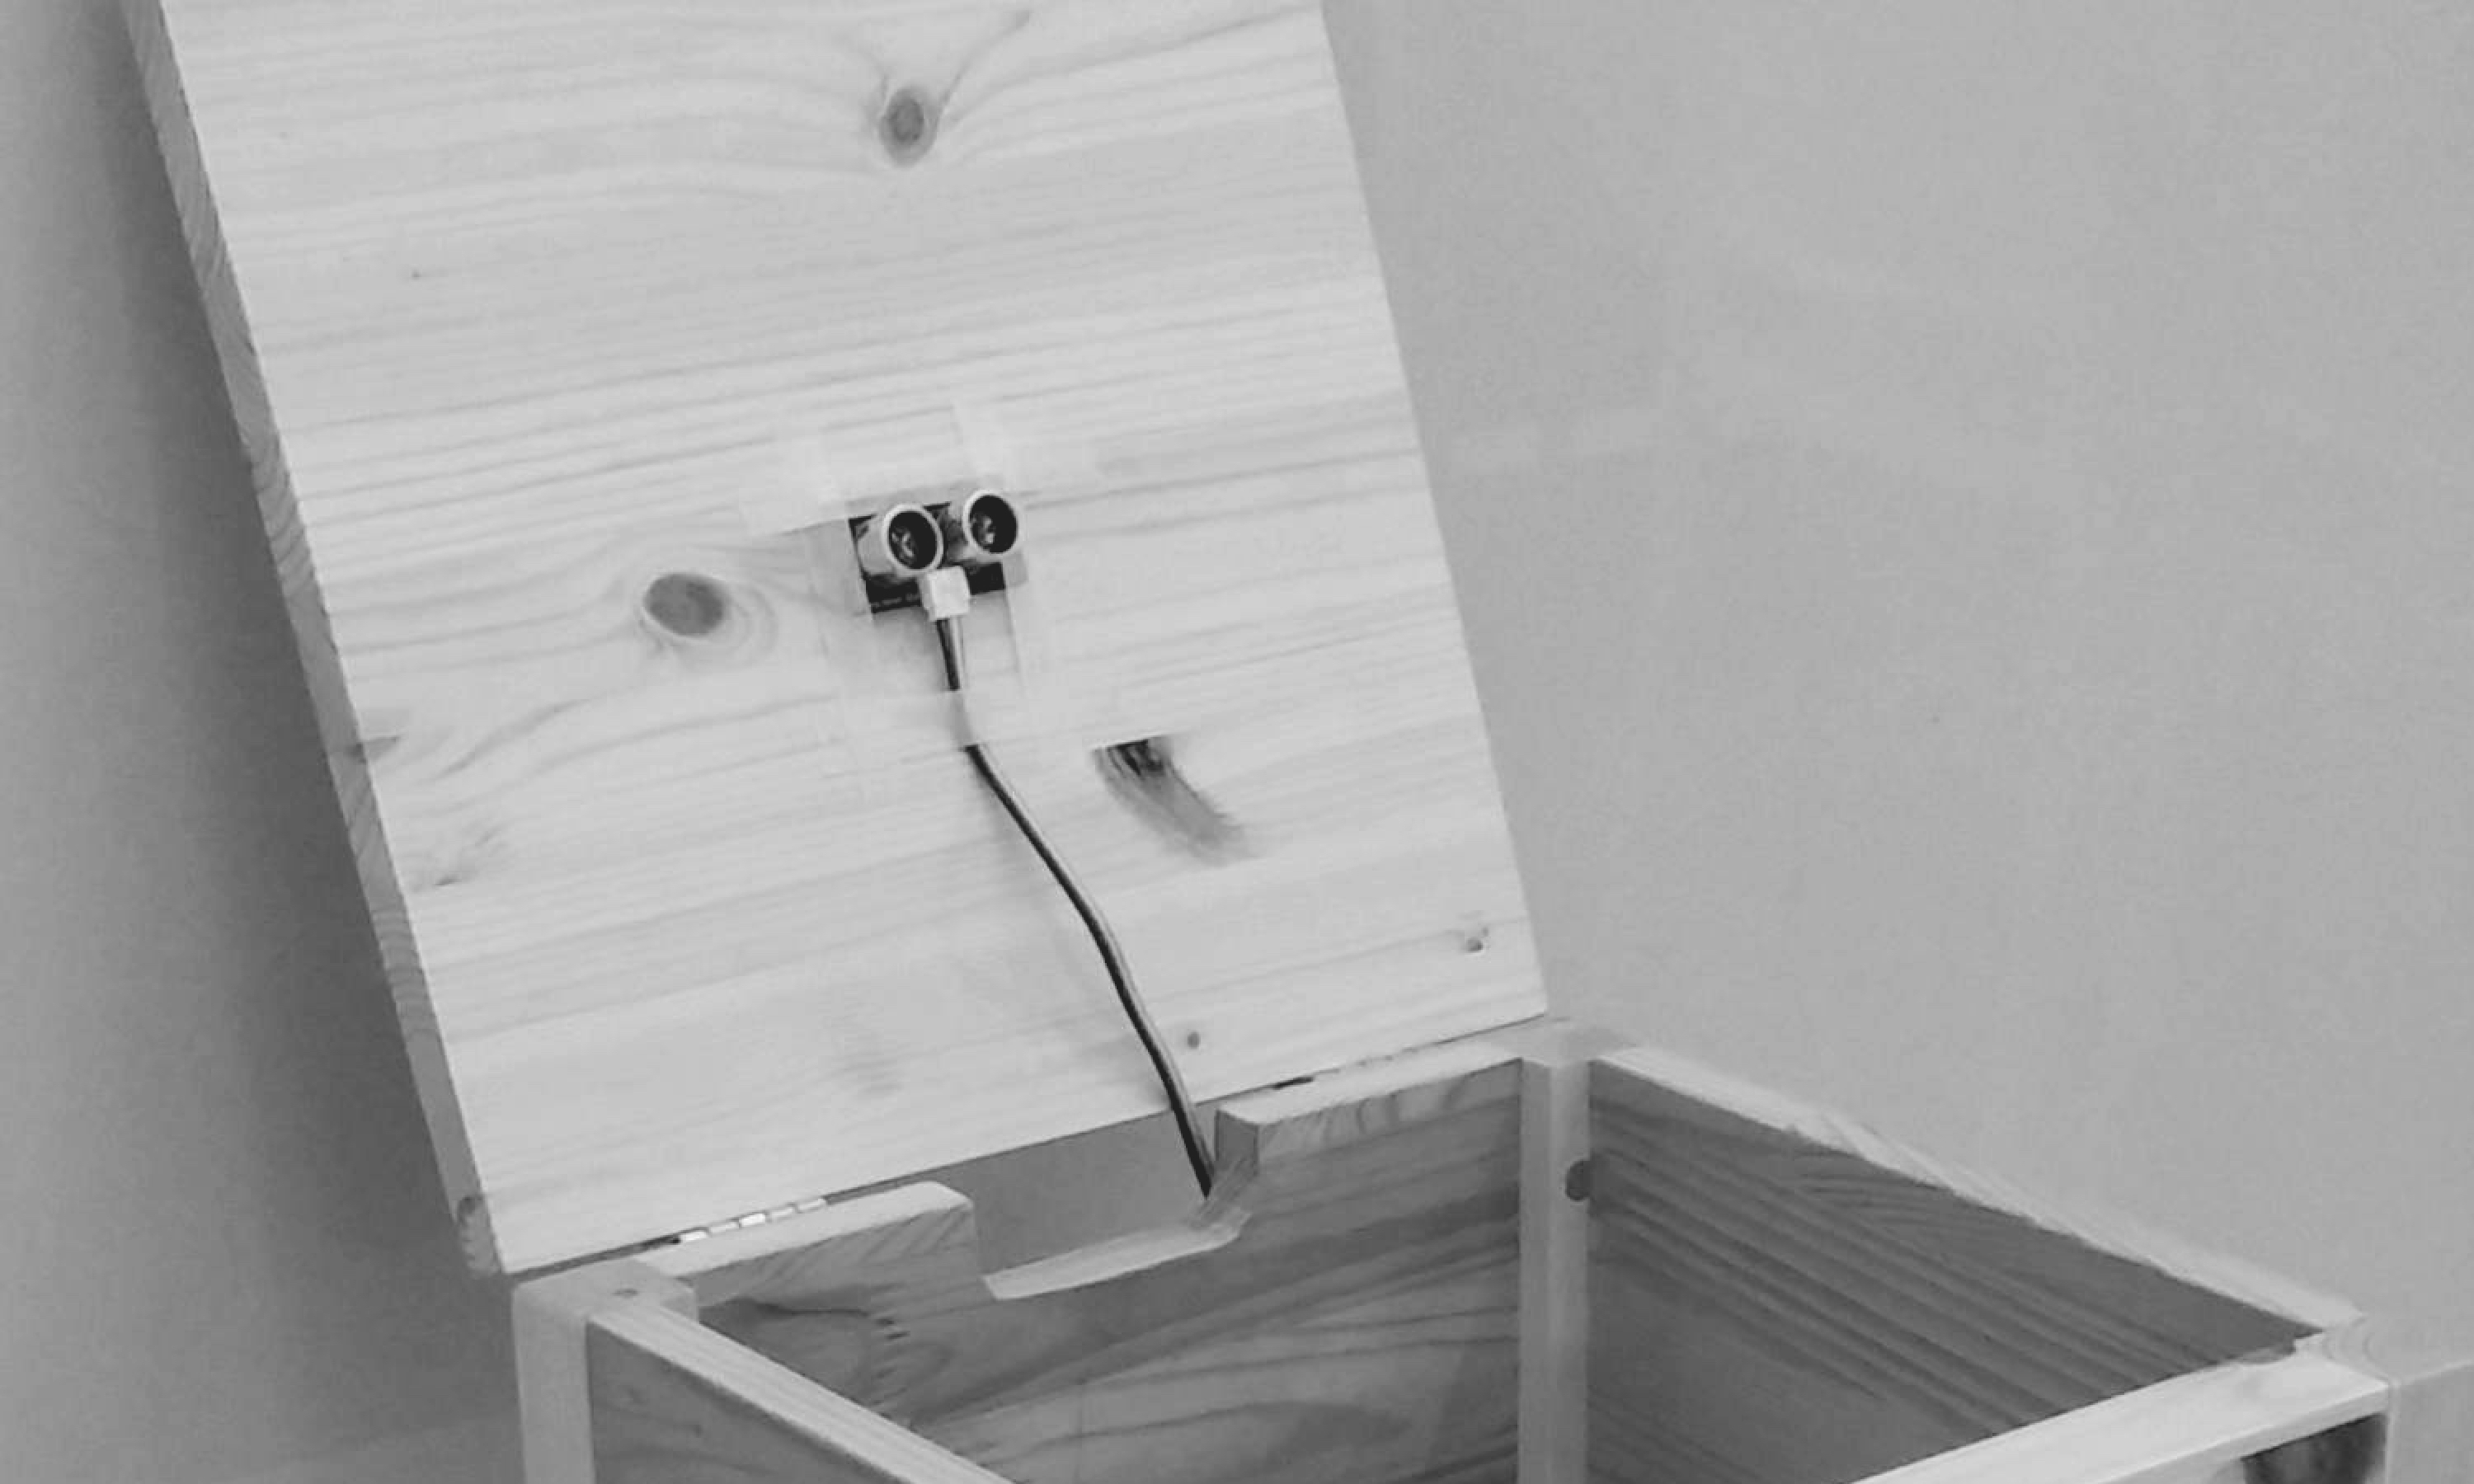
Sweepa is built using ultrasonic distance sensor. When the trash fills up, the ultrasonic distance sensor attached to the top of the trashcan detects the level and send its signal to the Arduino microchip. This information will be transferred into the computer which will then be uploaded on a web page. An Android application will display the same webview sharing the same internet network. Once the information is available on the Android application, users are able to check real time of the current states of the trashcan within their designated areas through their phones.This prototype proves efficiency and effectiveness of the Sweepa project in terms of decreased time in work completion and visually organized information.
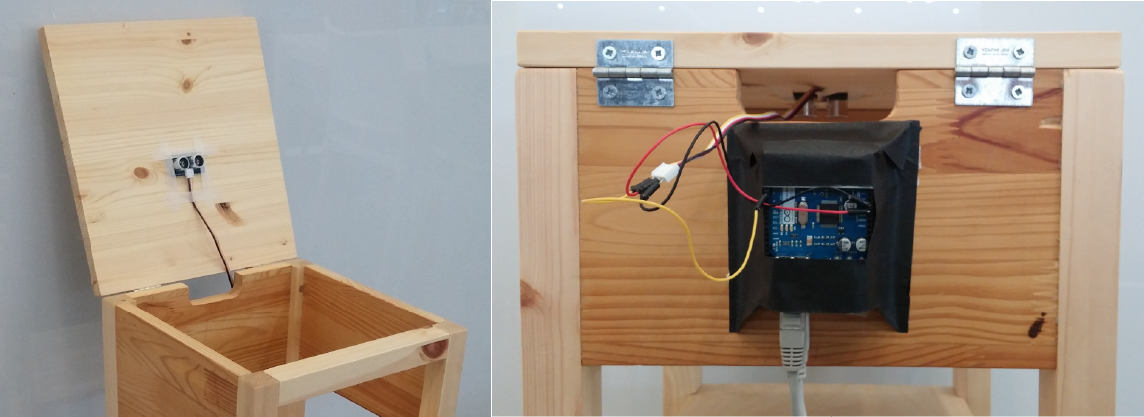
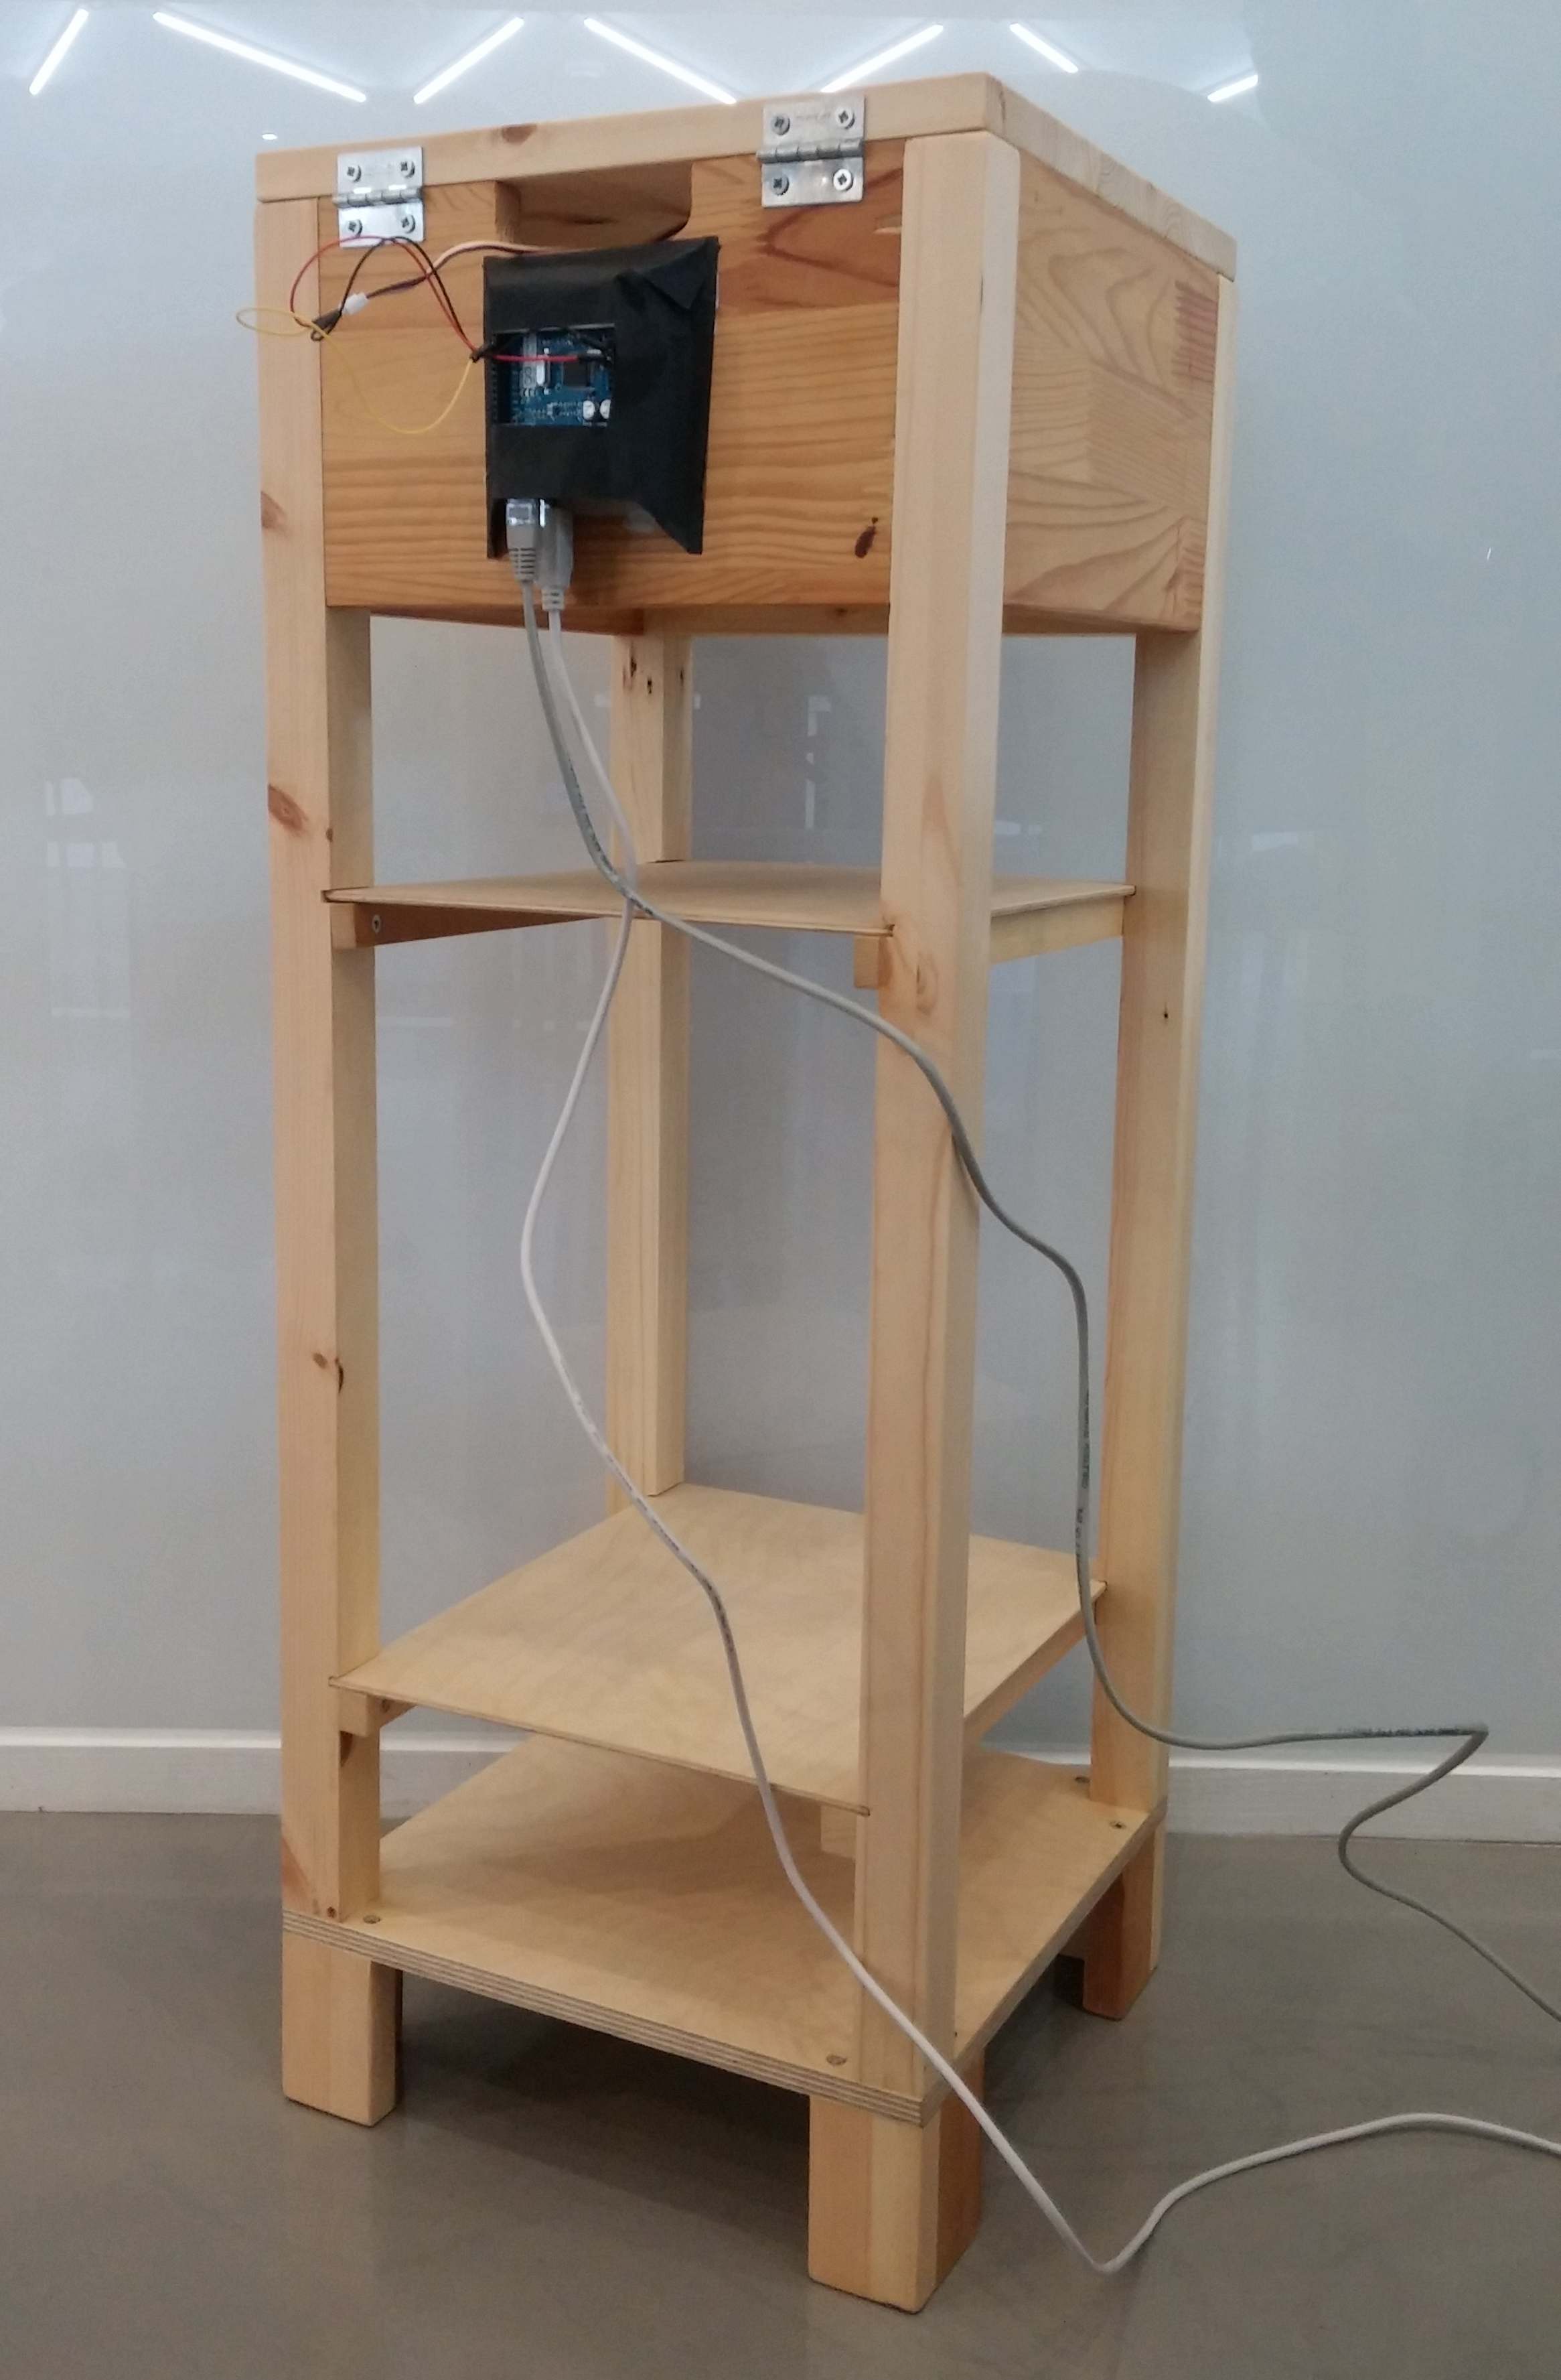
An Arduino board and an ultrasonic distance sensor are installed in the inner side of a trashcan facing downward. This sensor is connected to an Arduino Ethernet Shield. Then, the sensor calculates the distance from the top of the trashcan to the surface of the trash through ultrasonic sound waves. The data is transferred to the Arduino and Arduino converts the data into a more usable form to create a web page which displays the sensor inputs. Arduino Ethernet Shield can be replaced by a Wifi Shield which enables more flexibility in locating the trashcans.
The Arduino microprocessor is programmed in C language to take a reading of the distance from the sensor to the bottom of the trashcan. When the Arduino receives an input signal stating that the trash has reached a certain pre-determined threshold, it will send a data output to the computer terminal view. In this case, the pre-determined threshold is one second. Then, the Arduino program creates a web view on the certain IP address that can be accessed by only one network. Thus, this IP address enables users to make their own network. As the Arduino program refreshes the web view every second, it automatically updates the result value of the sensor. The web view consists of a floor map of the building and dots that represent the trashcans. The dots change their colors corresponding to the result value which the Arduino server sends. For this prototype, the depth of the trashcan is 70cm, and the Arduino is programmed to change color of the dots from green to orange when the depth is under 50cm. Also, the color changes from orange to red when the depth is under 20 cm. The information is transferred into Android application through the internet. The Android application presents the current state of the building with the same view of the web page.
In order to validate the efficiency of the Sweepa system, we conducted user testing that evaluated the usefulness and efficiency of Sweepa.
We designed an experiment in which participants were asked to play a role as a cleaning staff. We recruited eight undergraduate students through notice attached on the dormitory bulletin board.
The experiment was a within-subject study and each participant was required to inspect the state of 25 trashcans of the 1st floor of dormitory D twice - with and without the Sweepa mobile app which displayed the visual map of fill-levels of trashcans. Post-its were attached on the trashcans for the participants to collect, which indicated that the person has completed emptying a trashcan. The color of post-it denoted the state of the trashcans. Red post-it meant that trashcan is 80% full and participant must take off it. Green post-it meant that fill-level of the trashcan is less than 20% and participant is allowed not to take off the post-it. The participants were allowed to make their own route to complete their mission. Consequently, the completion time of each cycle was recorded. In the first cycle, the participants completed the mission without Sweepa. Mission of the participants was to observe the fill-level of each trashcan through color of the post-it, take off the red post-its and return to the start point. In the second cycle, the Sweepa mobile app was given to the participants. It displays the visual map of fill-levels of trashcans indicating which trashcan should be emptied. Thus, participants were allowed to skip the trashcans without actually observing each of them.
After the user testing, we conducted the individual survey. The questions were made up to see the satisfaction difference in five different aspects. The first aspect is ‘Cognition’. ‘Cognition’ measures the visual cognition and appropriateness of user interface - how easily users can recognize the function of the system. ‘Efficiency’ means overall satisfaction about the cost and time consumption of the system - the impact compared to the inputs. ‘Level of control on my work routine’ implies how much flexibility users have on their work routines. ‘Level of labor’ measures subjective changes of workload that users experienced. ‘Time consuming’ illustrates the satisfaction over the time consumption.
The results are recorded below. The average completion time without Sweepa was 7.85 minutes, while the average completion time with Sweepa was 5 minutes.
According to the survey conducted after the user testing, majority of the participants rated Sweepa positively in all 5 categories. Visual map enabled them to have increased cognition, and completion time clearly showed the decrease of time consumption and increase of efficiency. Overall view of users on level of control was quite positive since they were able to know the current state of the trashcans and able to plan their own route based on the pre-informed data. Moreover, inefficient amount of labor was reduced which resulted in majority number of participants that found the labor easier after using Sweepa.